Deep analytics,
on tap.
Cohorts, funnels, attribution and custom reports — across every channel you spend on. The depth of a data team, without the data team.
Inside the product
A tour through the reports.
Every screenshot is a real Glowytics view used by real brands. No marketing mockups.
Report 01
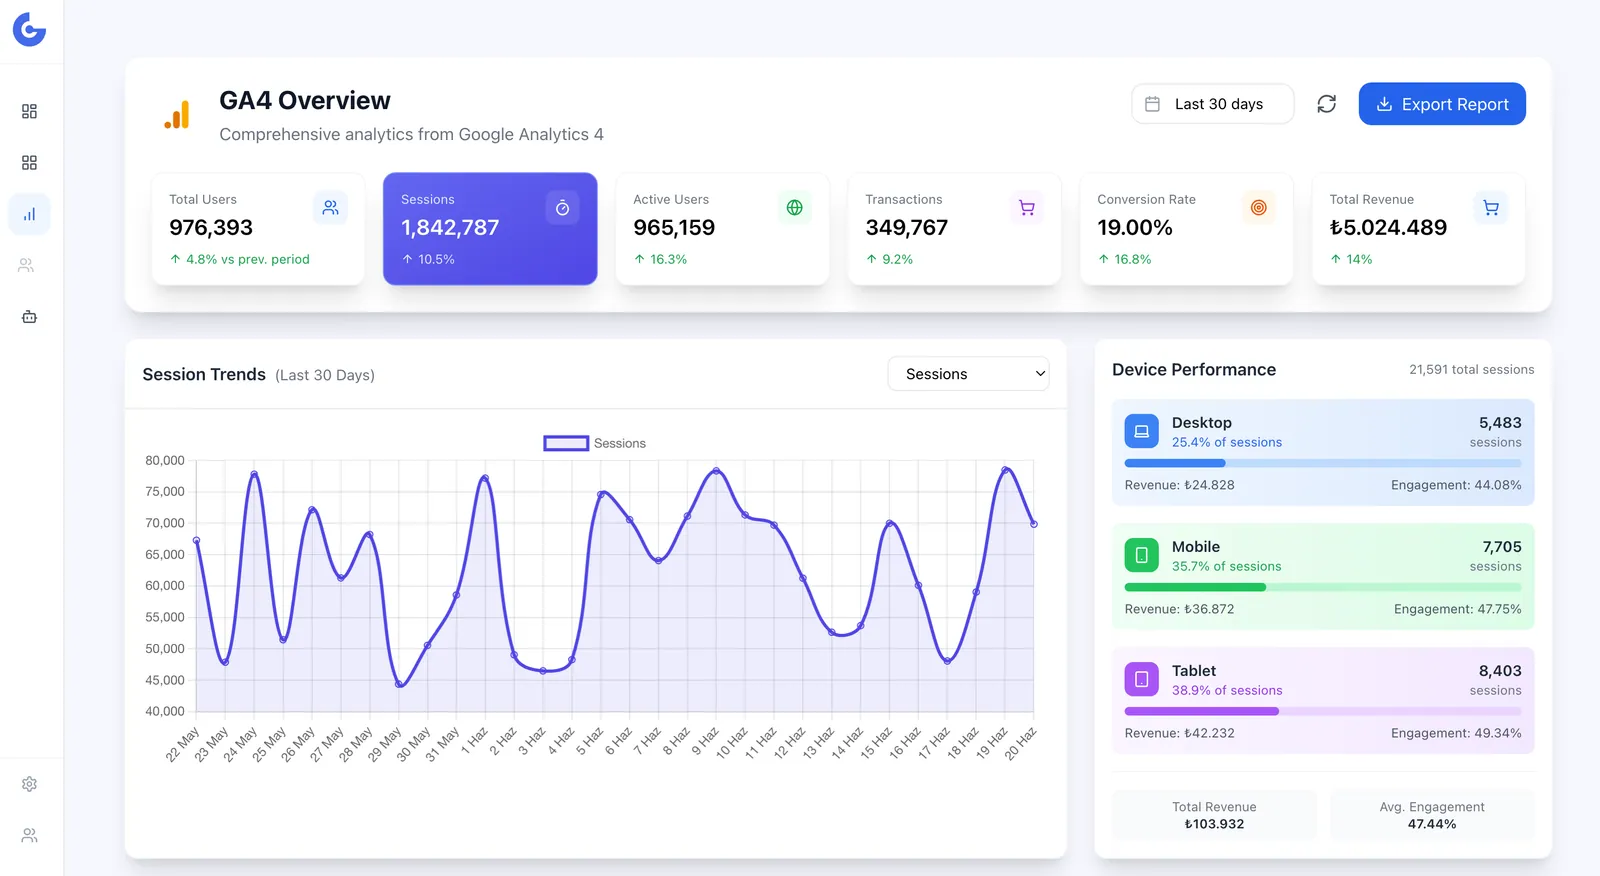
GA4 unified overview
Sessions, conversions and revenue from Google Analytics — joined to your ad spend.
Report 02
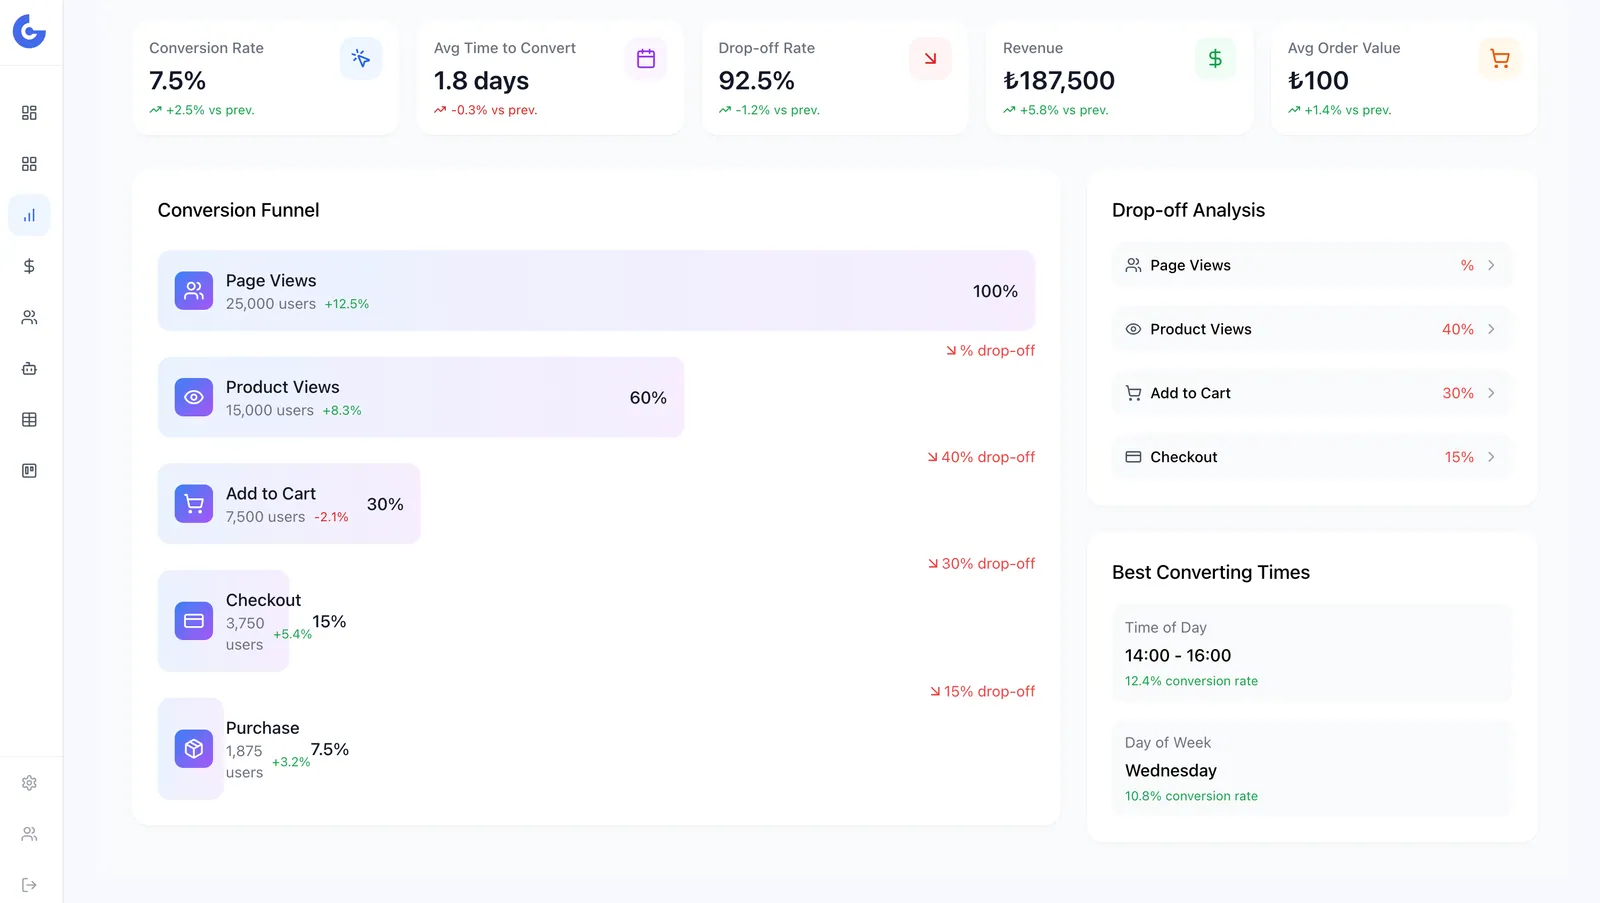
Funnel analysis
Visualize step-by-step drop-off. See exactly where customers leak.
Report 03
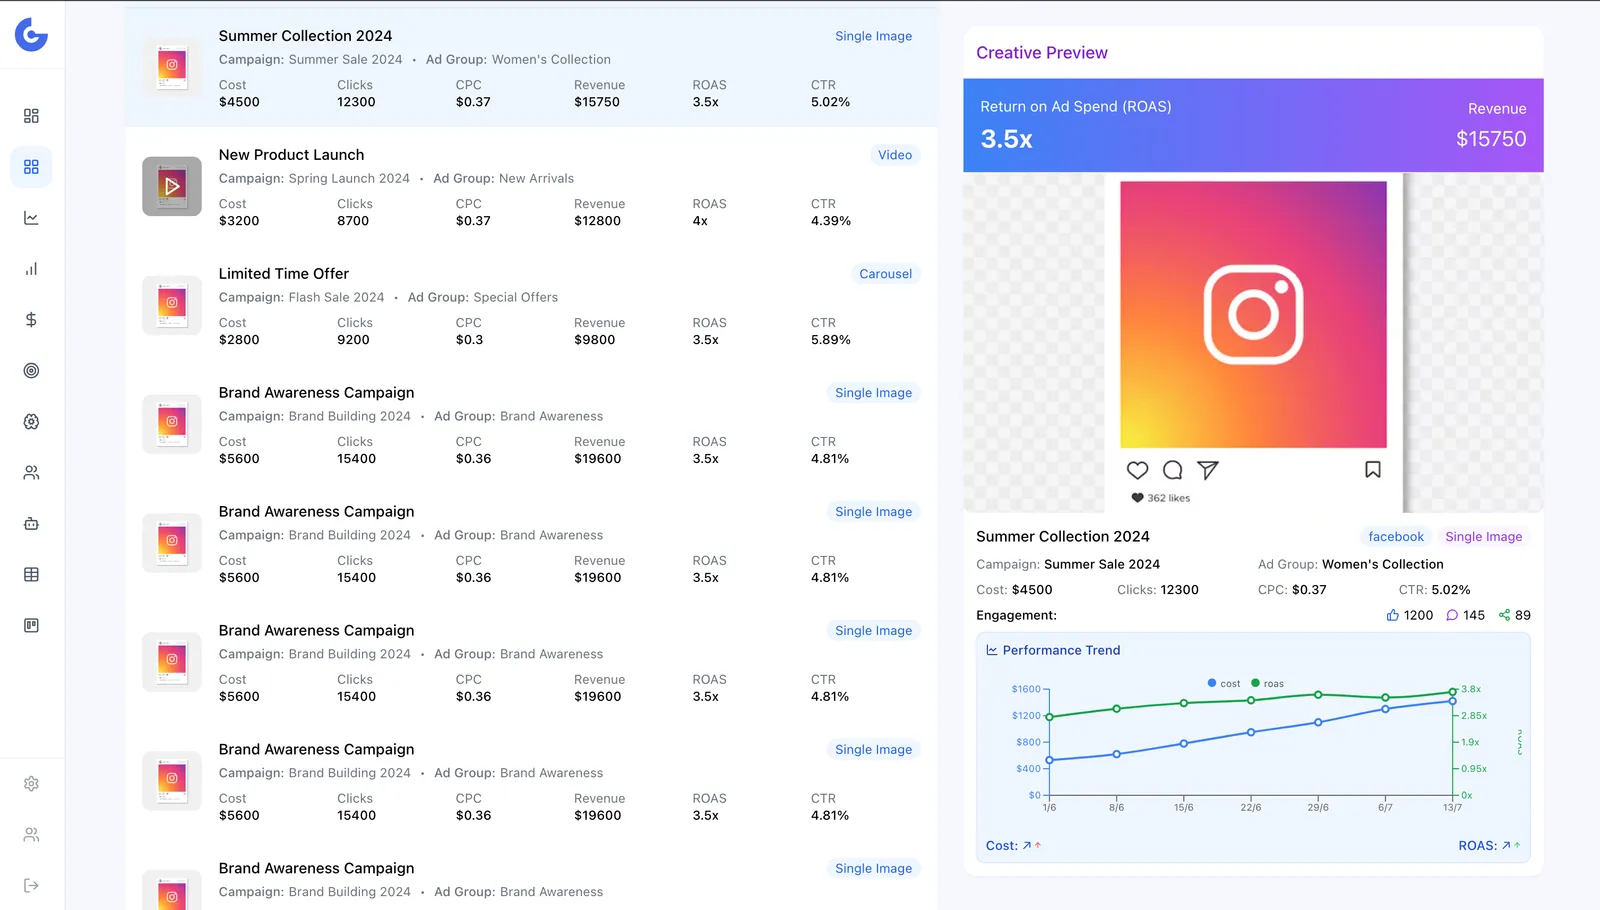
Creative performance
Which ad, which audience, which placement actually drives ROAS.
What you can do
Six things your current dashboard probably can't
Glowytics analytics is built for the questions you actually ask in a Monday review — not the ones a generic BI tool answers.
Cohort & retention analysis
Slice users by acquisition week, channel or campaign and watch how they retain (or churn) over time.
Funnel & journey analysis
Visualize drop-offs at every step. Layer paid + organic + email + push to see the full path to purchase.
Attribution that doesn't lie
Compare last-click, time-decay, linear and data-driven side-by-side — pick the model that matches your business.
Custom reports & pivots
Build reports your way: dimensions, breakdowns, filters, computed metrics. Save, schedule and share.
Hourly & intraday data
Watch revenue pace by hour. Catch a spike (or a flatline) before lunch, not on Monday morning.
Ask GlowyAI in plain language
"What was Meta CPA last week vs the week before?" — type the question, get the chart and the answer.
How it works
Connect your sources
GA4, BigQuery, Google Ads, Meta, TikTok, your store. We handle the schema.
Pick a question
Pre-built reports for cohorts, funnels, attribution and creatives — or build your own.
Get answers, not data
GlowyAI summarizes what changed and why. Share findings with one link.
Stop building the same chart in three tools.
14-day free trial. Connect your data, get your first answer in under an hour.