The analysis a data team
would build you.
BCG portfolio matrices, per-product price elasticity and revenue forecasting — modelled on your own catalogue and running continuously. The work that normally arrives as a one-off deck, as a live report.
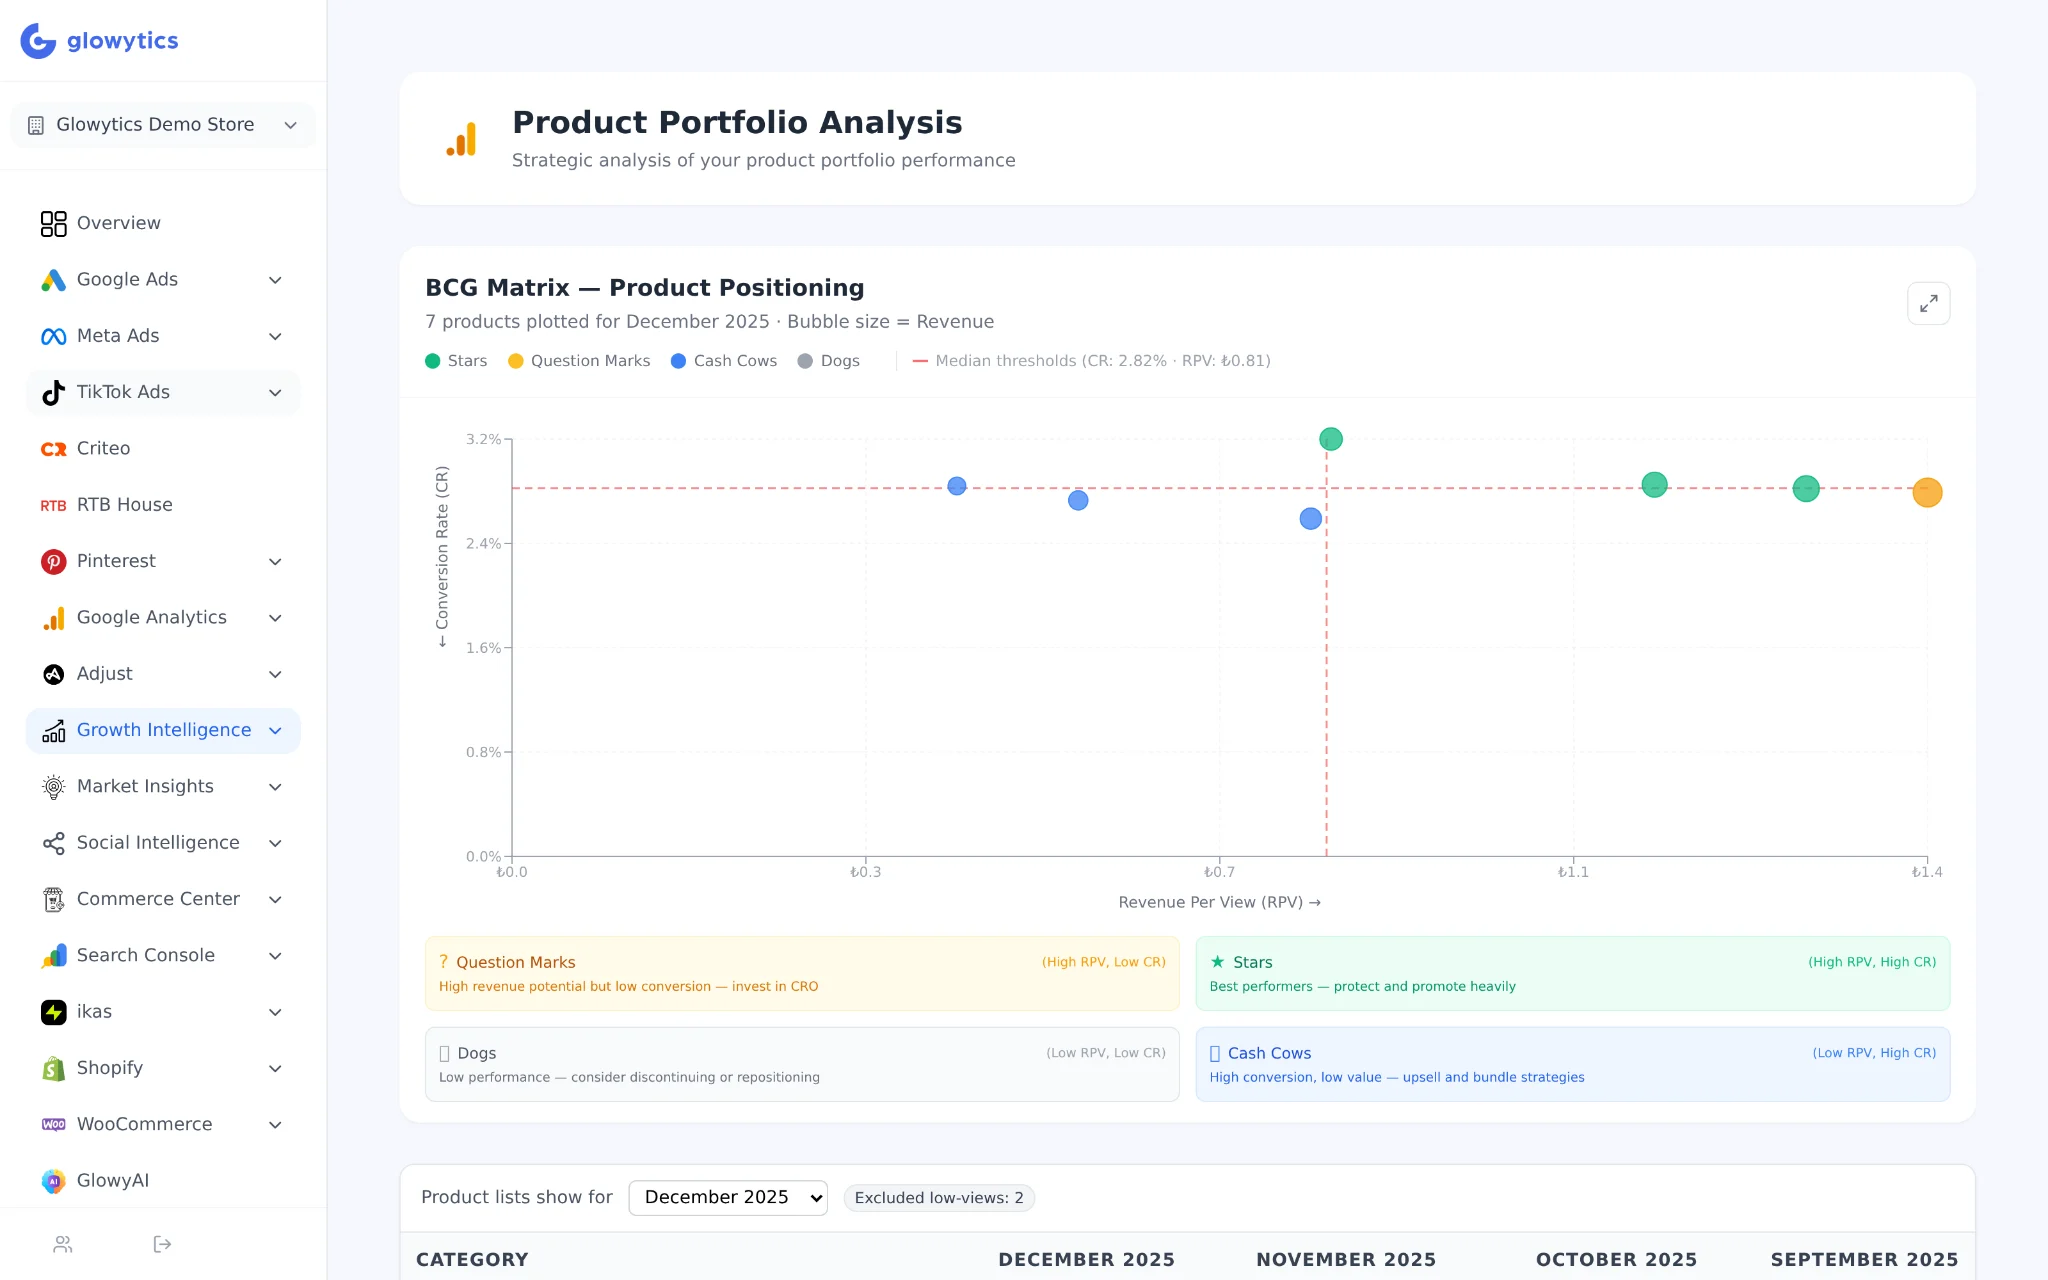
The model, before the report
Every product has a job. Most catalogues never assign one.
Hover a quadrant. This is the same split Glowytics runs on your catalogue every day — on your revenue per view and your conversion rate, against your own medians.
Revenue per view →
Hover a quadrant to see the strategy.
What you actually get
Four models, named.
Not “AI-powered growth” — the specific analyses that ship, and the decision each one supports.
4 reports included
Portfolio & pricing
Product Portfolio Analysis
Which products are stars, cash cows, question marks or dogs — plotted on revenue per view against conversion rate.
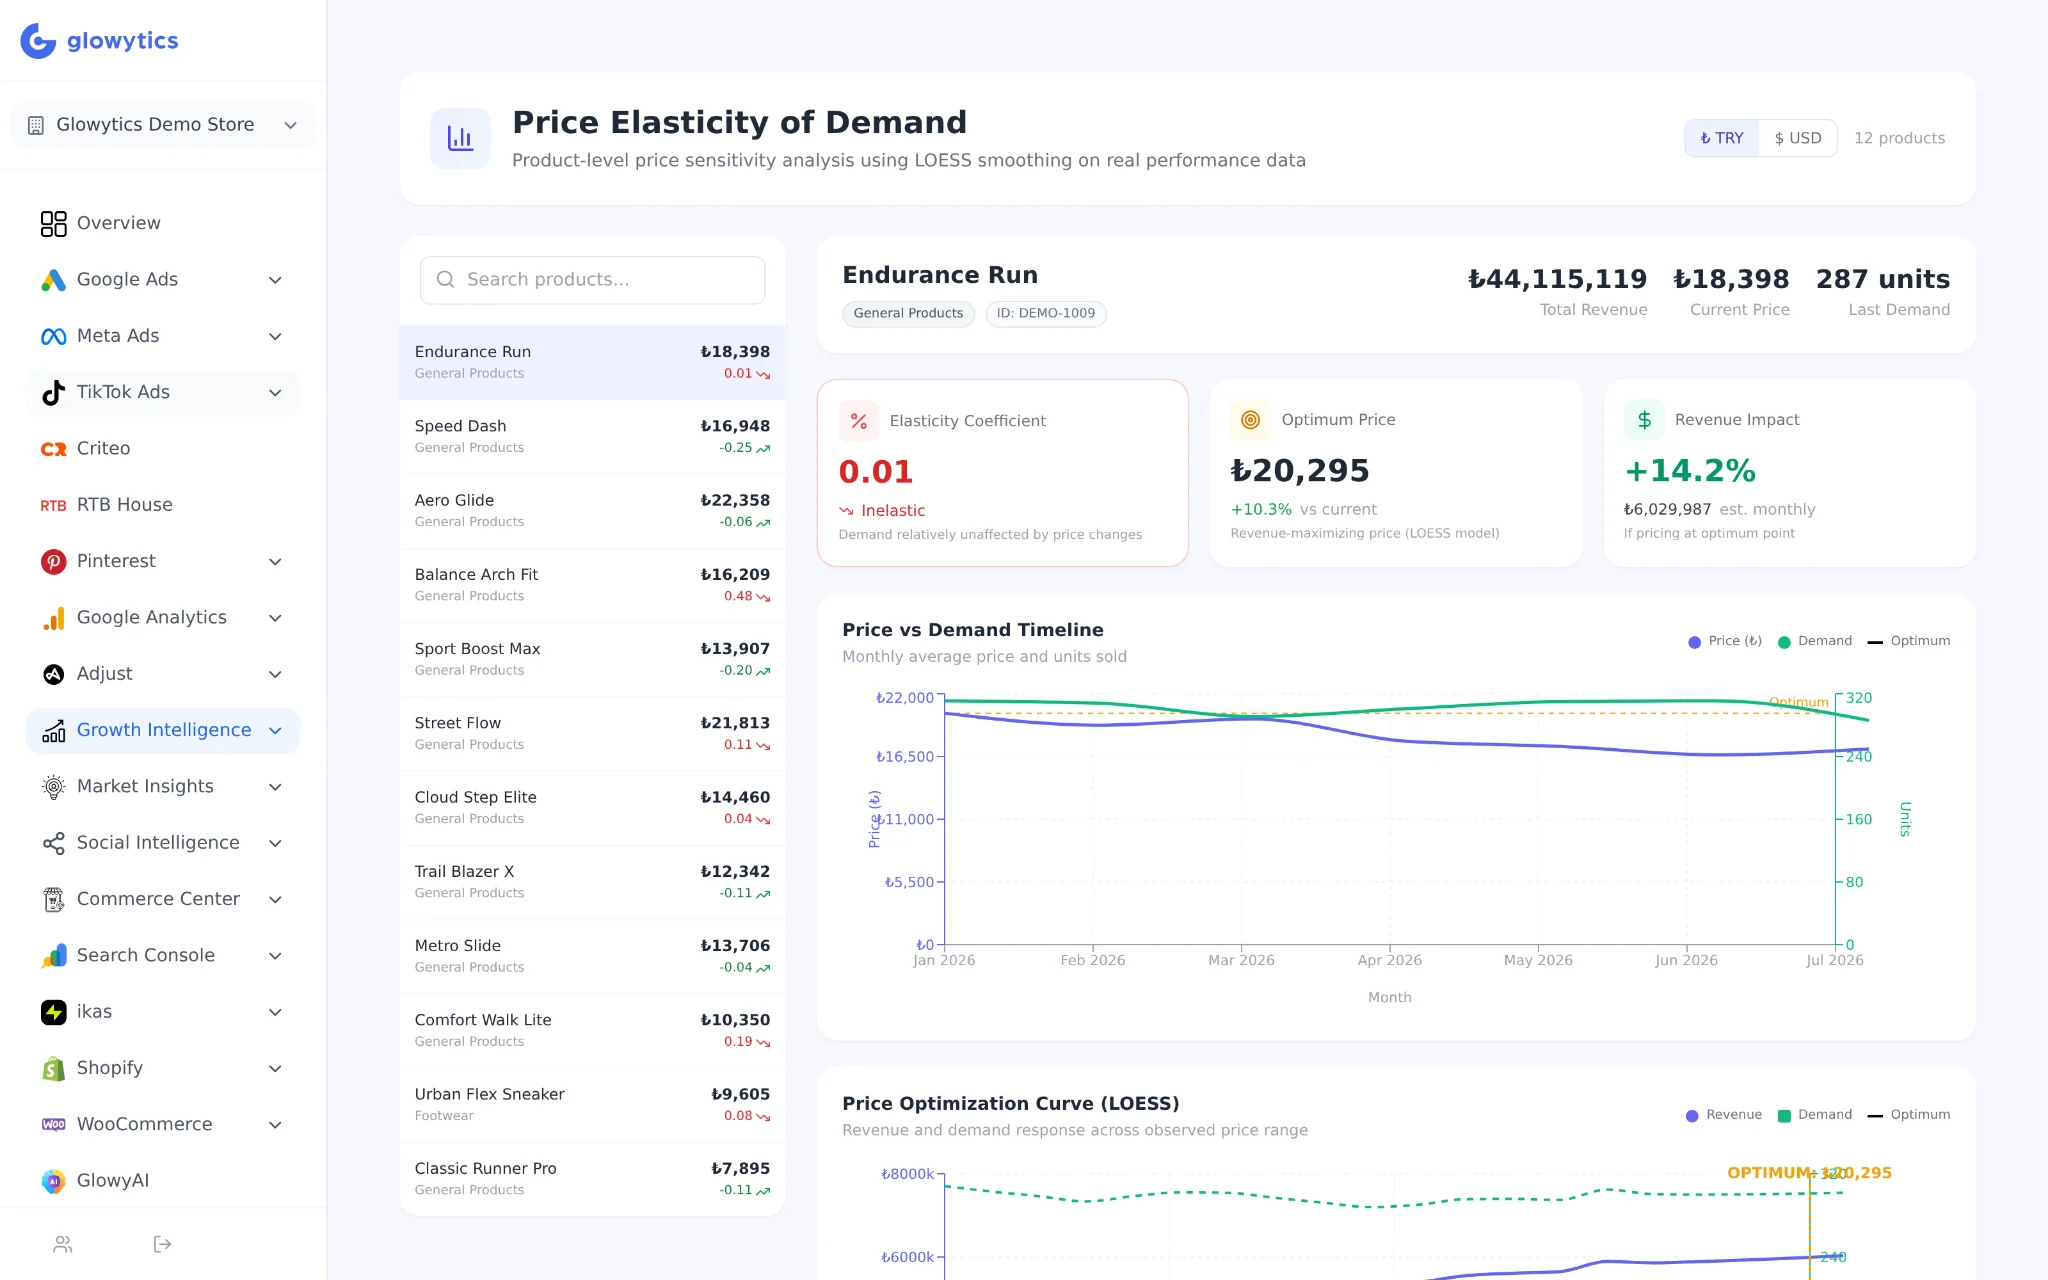
Price Elasticity of Demand
How sensitive each product is to price, and what the revenue-maximising price would be.
Planning
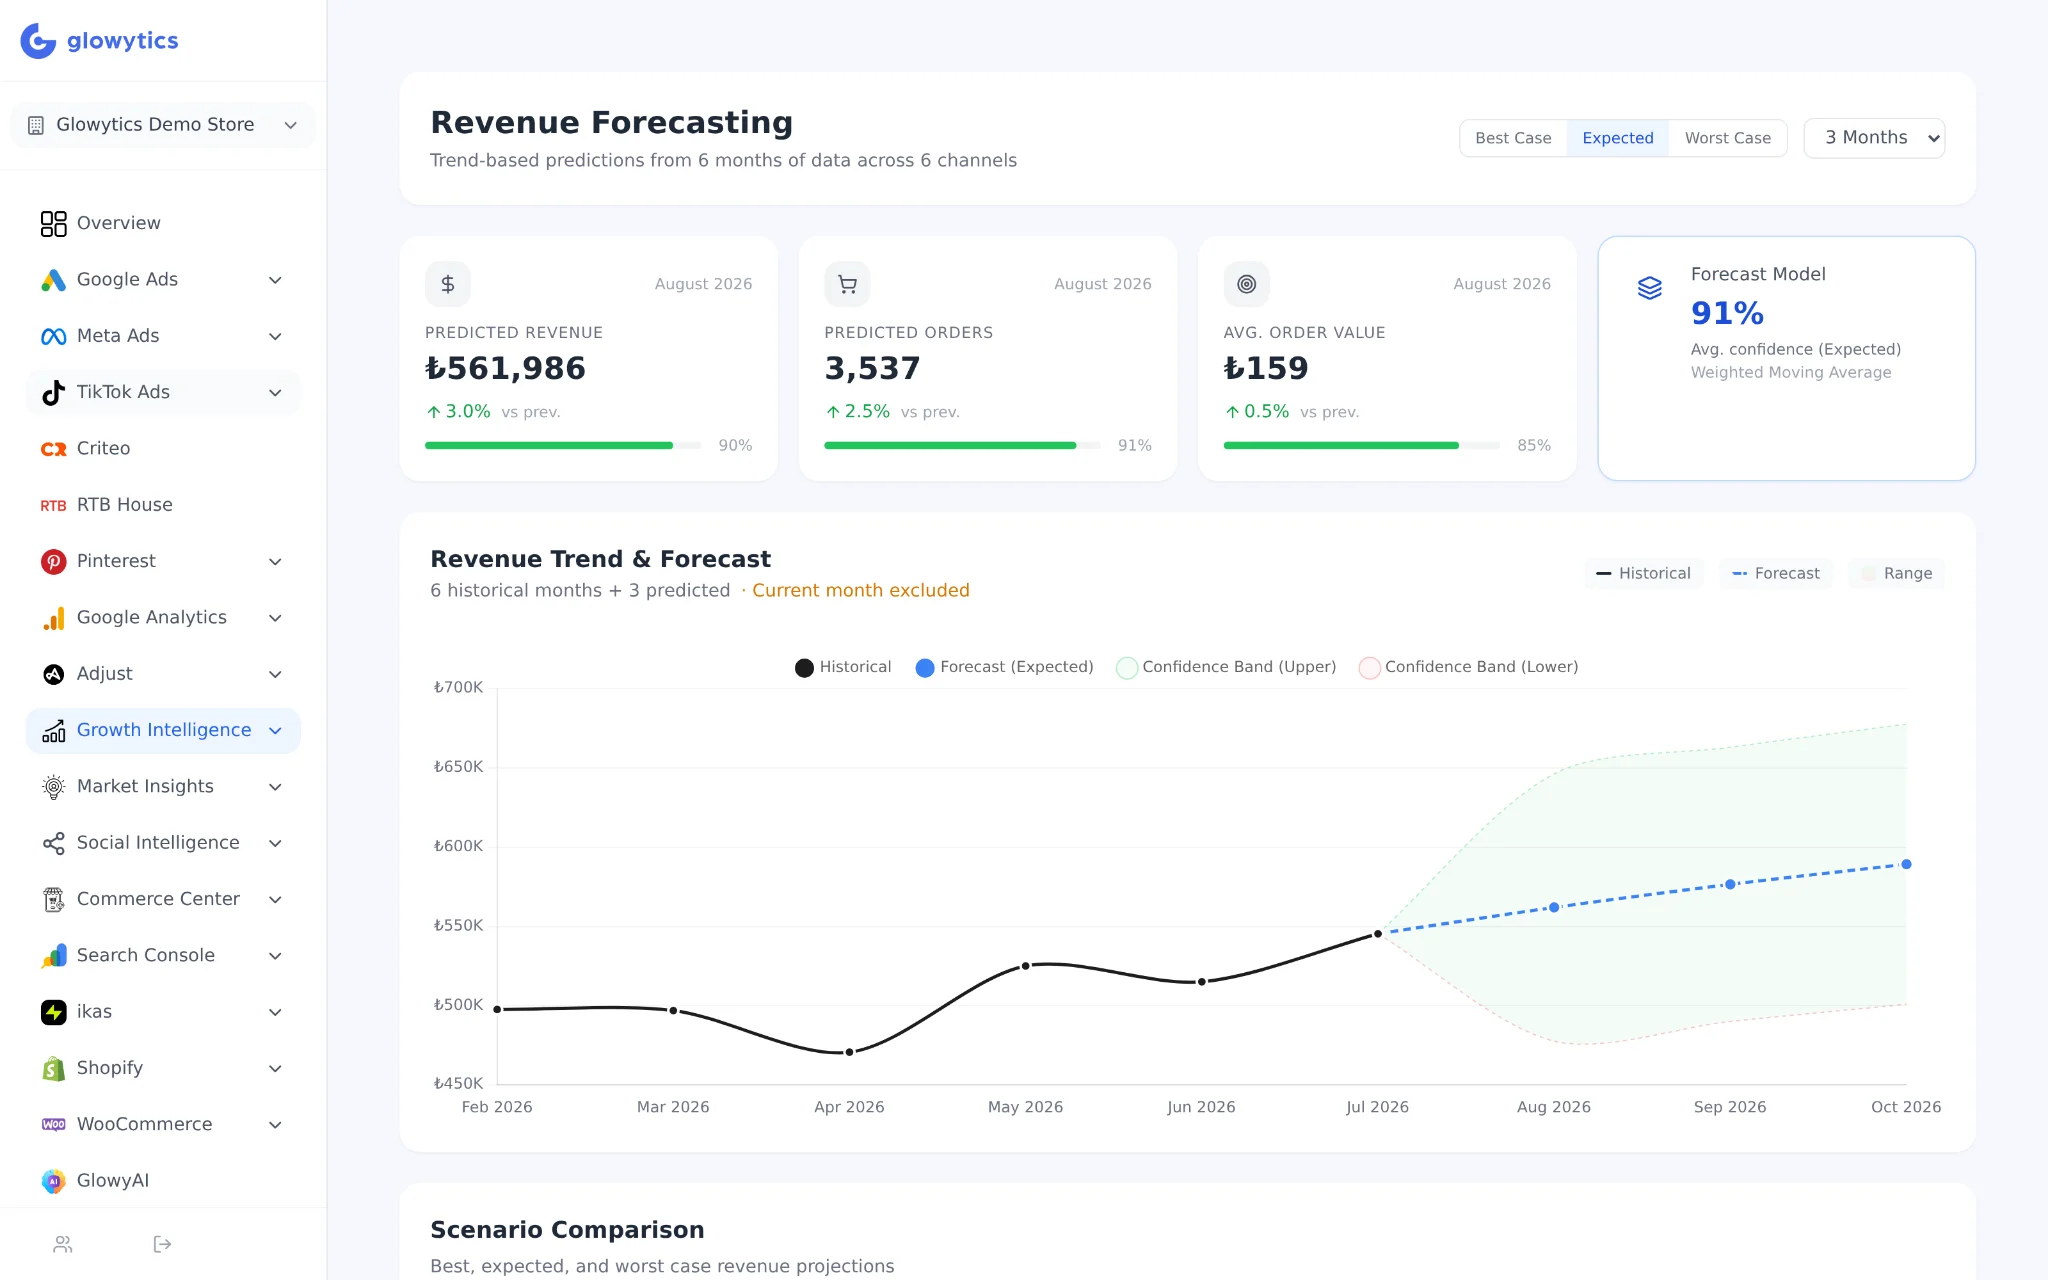
Revenue Forecasting
Where revenue lands if the current trend and seasonality hold.
Campaign Periods
Like-for-like comparison of campaign windows across years, instead of calendar months.
Portfolio and elasticity models need enough observed price and demand history per product; items below the view threshold are excluded and reported as such.
Inside the product
Beyond the matrix.
Both captured from a live Glowytics account. No marketing mockups.
Report 01
Price elasticity, per product
A LOESS model over your real price and demand history returns the elasticity coefficient, the revenue-maximising price and the revenue impact of moving to it. Not a category rule of thumb — this product.
Report 02
Revenue forecasting
Projects revenue forward from your own seasonality and trend, so the monthly target conversation starts from a number instead of last year plus ten percent.
How it works
Connect analytics and your store
GA4 plus your commerce platform. Product views, conversions, price history and revenue are all we need.
Let the models run
The matrix, the elasticity curves and the forecast rebuild as new data lands — no analyst re-running a notebook.
Turn quadrants into decisions
Protect the stars, reprice the inelastic, fix conversion on the question marks, retire the dogs.
Find out what each product is actually for.
14-day free trial. Connect your data and get your portfolio matrix in under an hour.