See the ad,
not the ad ID.
Creative-level reporting for Meta, TikTok, Pinterest and Google — with every image and video rendered right next to its spend, ROAS and CPM. The report your creative team can actually read.
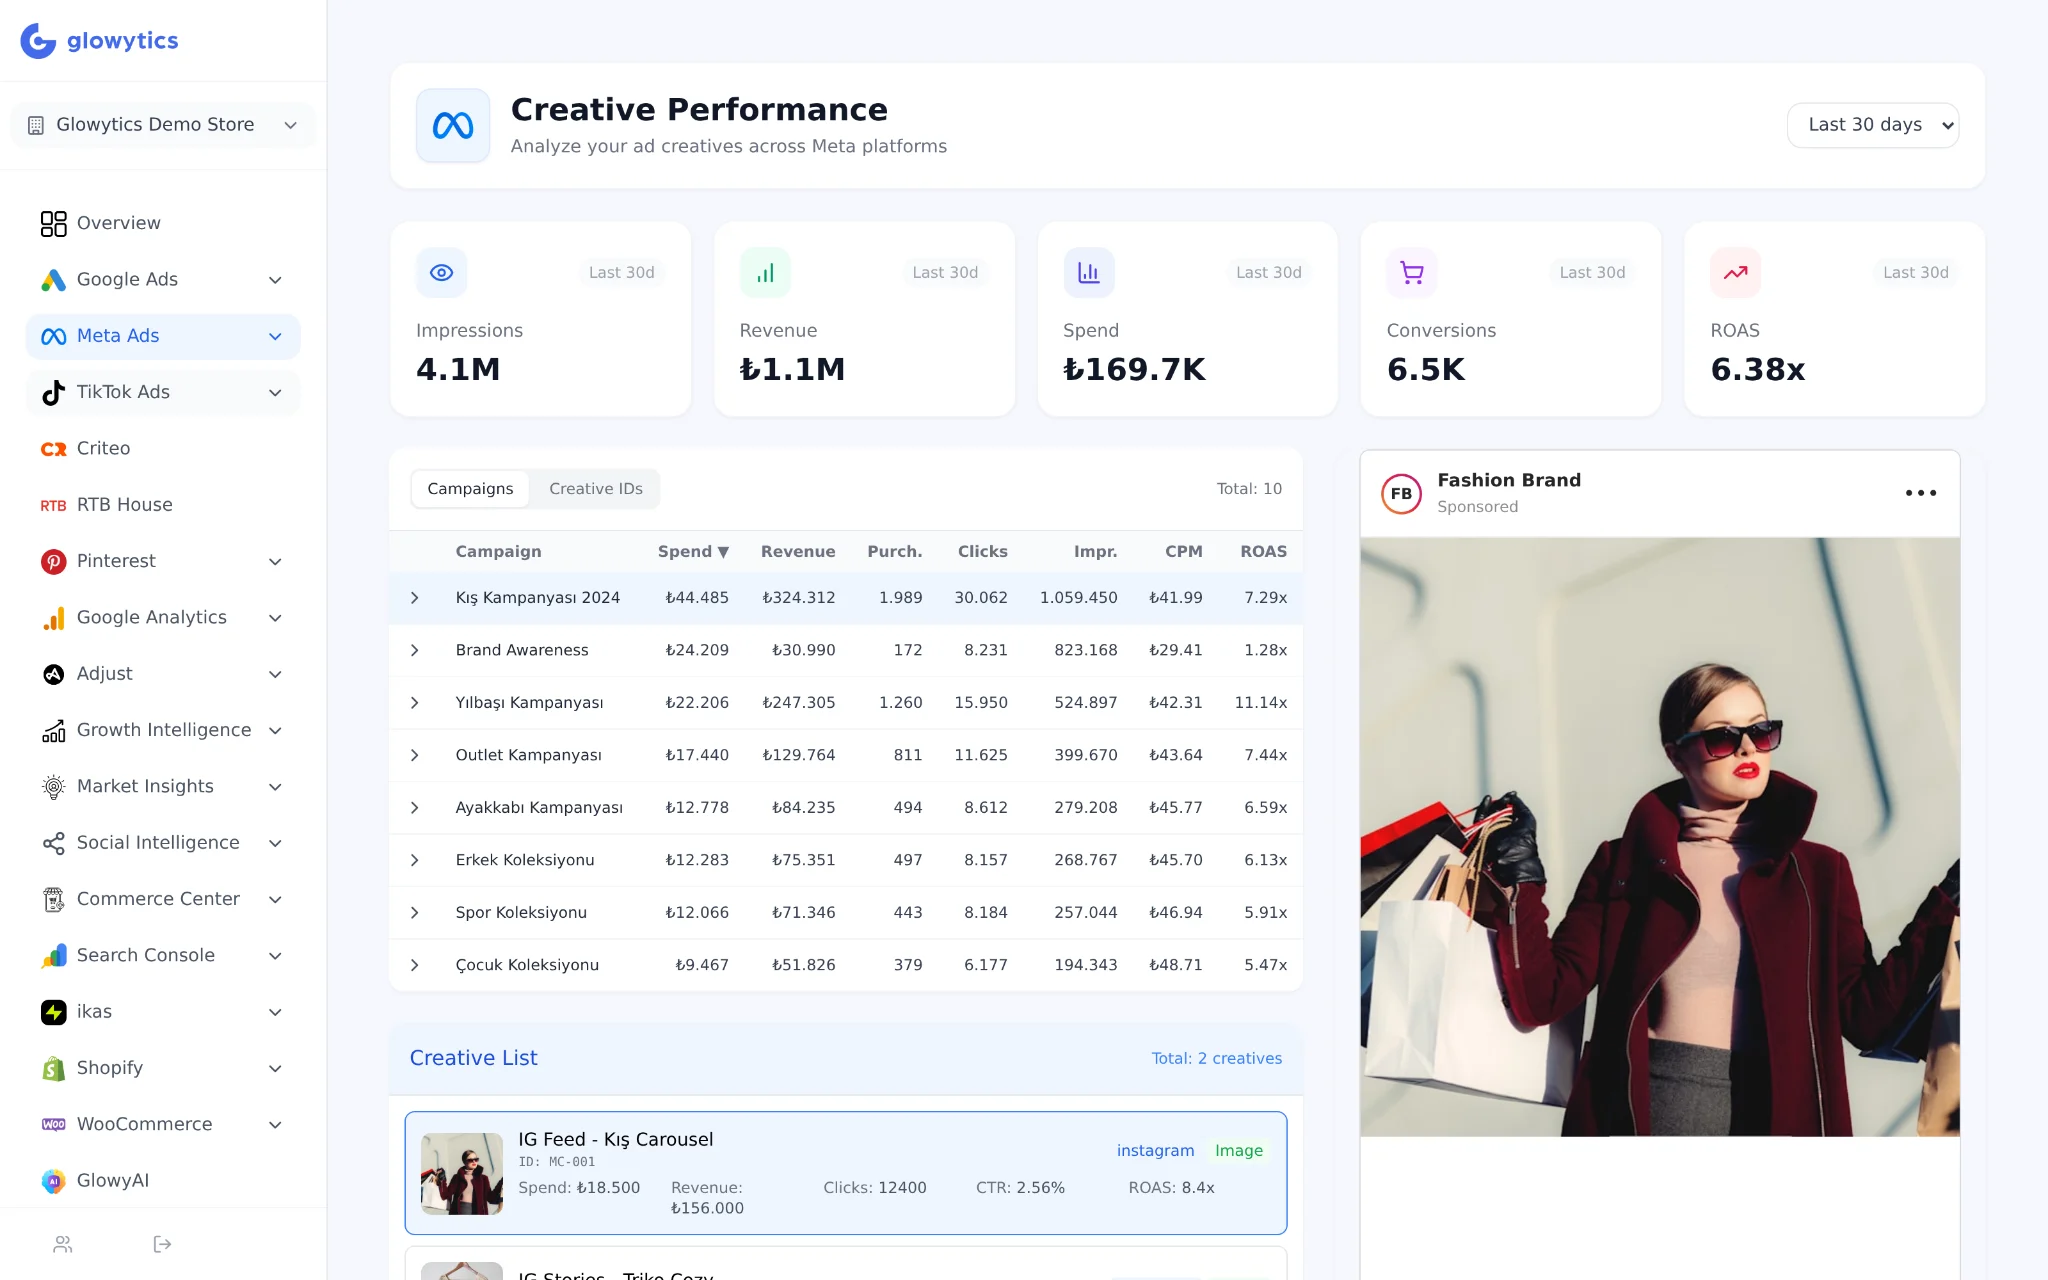
One view, every platform
Same report.
Four ad platforms.
Switch the platform, keep the layout. That is the whole point — comparing a TikTok creative to a Meta one should not mean learning two dashboards.
Impressions
4.1M
Spend
₺169.7K
Conversions
6.5K
ROAS
6.38x
Spend, revenue, purchases, clicks, CPM and ROAS per campaign — with the actual creative rendered beside the table. You stop guessing which ad “Kış Kampanyası” refers to.
Why it matters
Creative is where the performance gap actually is
Bidding is largely automated now. The lever left is which asset you put in front of which audience — and most reporting stops one level above that decision.
The creative, not just its ID
Every row renders the real image or video. No more cross-referencing ad IDs against a Drive folder to find out what ran.
One grammar across four platforms
Meta, TikTok, Pinterest and Google use different names for the same metric. We normalise them so a creative comparison actually compares.
Format and placement breakdown
Single video, carousel, static, story. See which format wins per audience instead of averaging them into one meaningless CPM.
Campaign → ad set → creative
Expand any campaign down to the individual asset. The drop-off usually lives two levels below where the dashboards stop.
Sort by what you are optimising
Spend, ROAS, CPM, purchases, CTR — pick the column, sort, and the kill list writes itself.
Feeds the AI assistant
Ask GlowyAI which creative themes are winning and it reads these same tables — the answer is grounded in your data, not a guess.
What you actually get
Seven creative reports, named.
Not “creative insights” — the specific screens that ship, and the question each one answers.
7 reports included
Social platforms
Meta Creative Performance
Which Facebook and Instagram creative drove spend, revenue and ROAS — with the ad previewed next to the row.
TikTok Creative Performance
In-feed video performance by ad, with the clip shown in its native frame.
Pinterest Creative Performance
Pin-level breakdown, below the level Pinterest Ads Manager reports at.
Google surfaces
GDN Creatives
Which display banners and sizes are actually being served, and what they return.
PMax Asset Performance
The asset-level view Performance Max normally hides — headlines, images and videos inside the black box.
Catalogue creatives
Catalog Product Spend
Which individual products inside a dynamic catalogue campaign are absorbing the budget.
Meta A/B Test (Live)
Two creatives side by side on live data, without waiting for the platform to declare a winner.
Each report requires the matching ad account to be connected. PMax asset data is limited to what the Google Ads API exposes for the campaign.
Stop reviewing creatives from a spreadsheet of IDs.
14-day free trial. Connect one ad account and see your creatives ranked within the hour.