Your Data,
Your Way.
One size doesn't fit all. Build custom dashboards, create unique metrics, and visualize your performance exactly how you want it.
Inside the product
A canvas for the questions only your team asks.
Mix KPIs, charts and tables on a board built around how your business measures success.
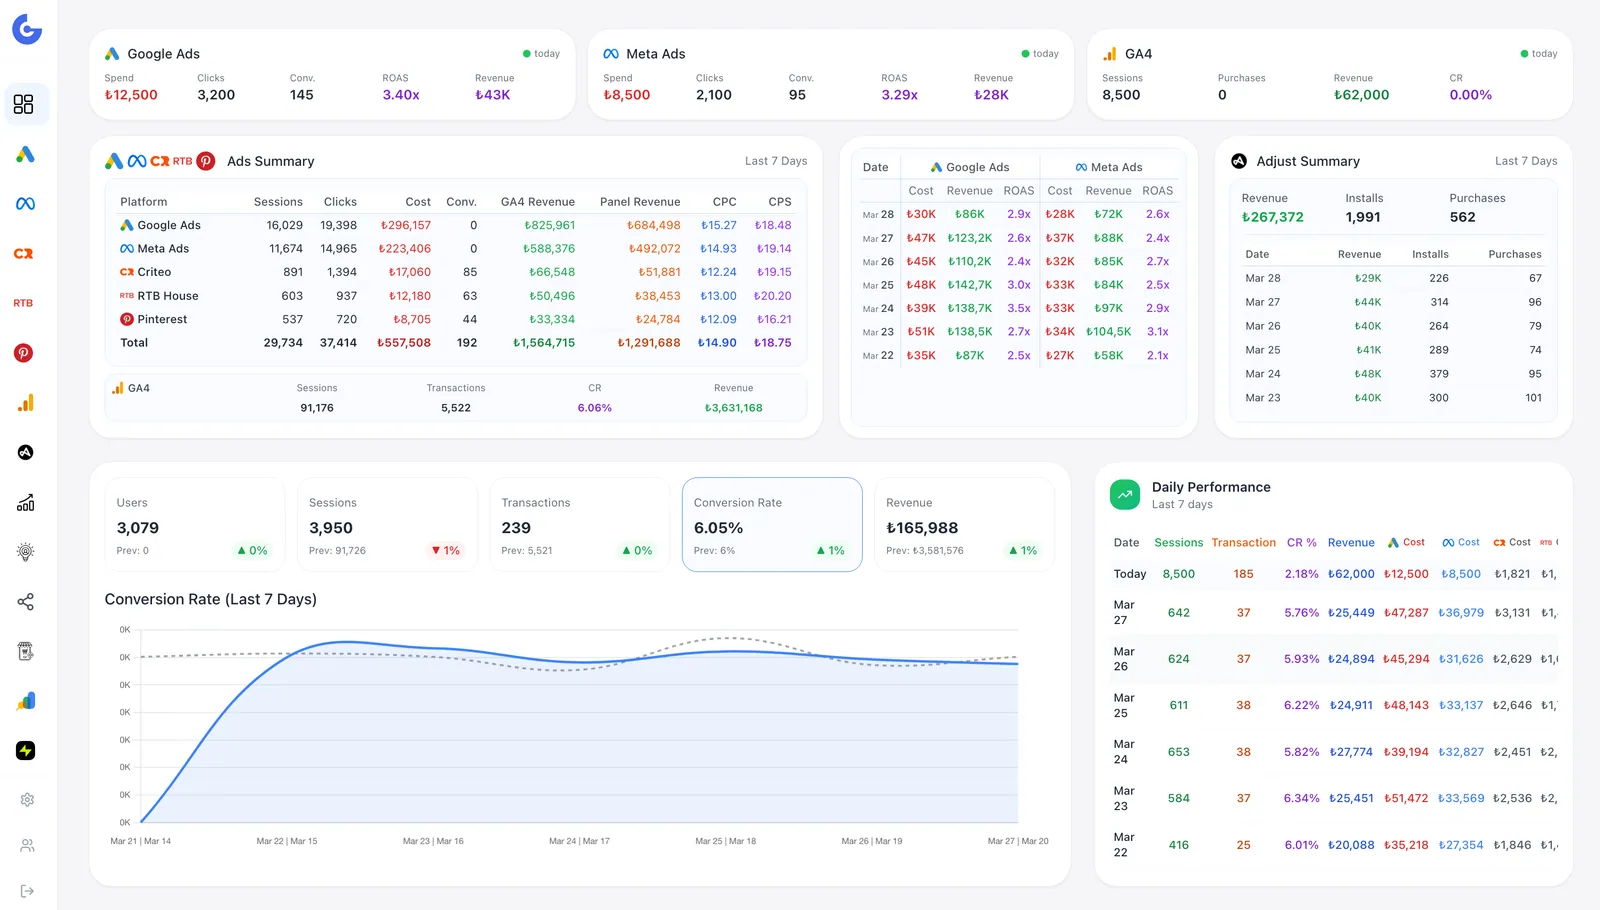
No Limits Analysis
Don't settle for preset reports. Dig deeper and find the answers that matter to you.
Drag & Drop Builder
No coding required. Build your dream dashboard by simply dragging widgets onto the canvas and resizing them to fit.
Granular Filtering
Drill down deep. Filter by device, region, campaign type, or custom tags to find the specific data points you need.
Custom Metrics
Create your own formulas. Combine metrics like 'Total Spend' / 'New Users' to track KPIs unique to your business.
Visualization Library
Choose from over 50+ chart types including heatmaps, scatter plots, and funnel charts to tell your data story best.
Saved Views
Don't rebuild the same report twice. Save your favorite filter combinations and dashboard layouts for instant access.
Data Blending
View Google Ads spend alongside Shopify revenue in a single chart to calculate true ROI in real-time.
50+ Pre-Built Widgets
Start fast with our library of best-practice widgets for SaaS, E-commerce, and Lead Gen.
Design Your Perfect Dashboard
Give your team the exact data they need to succeed. Try the builder free for 14 days.